From the FreeTxt Home page, click on Analysis.
- Paste a text [copy and paste text into the box - this is useful if your data is not a .txt, .tsv or .xlsx file e.g. data you may have in a WORD document]
- Use example data [you will need to select from the options below - this is useful if you just want to try out this tool initially]
- Upload data file [this allows you to upload data directly by clicking on choose file and selecting the appropriate file. This option only works for .txt, .tsv or .xlsx files - see (i) above]
The Sentiment Chart allows you to create a scatter plot of your data. You will find an overview of what a scatter plot is and how it might be useful to you in the analysis of your data under the sentiment chart tab.

Below is a scatter plot based on the data in example data in FreeTxt (see 'use example data' in the 'How can I...' section). The top positive and top negative/neutral words are listed in columns to the right of the plot. Hovering over a word in these lists highlights where it is in the scatter plot, which is useful if you have large amounts of data to analyse. By hovering over a specific word in the scatter plot, you see information about how often it is used in the dataset, along with its’ score (ranging from -1 to 1).

If you click on an individual word within the scatter plot, you can view examples of how it is used in sentences with either a positive and/or negative sentiment in your text. For example, clicking the word 'budget' in the sample data, you will see all of the occasions 'budget' is used in a sentence that has been analysed as being positive.

From the FreeTxt Home page, click on Analysis.
- Paste a text [copy and paste text into the box - this is useful if your data is not a .txt, .tsv or .xlsx file e.g. data you may have in a WORD document]
- Use example data [you will need to select from the options below - this is useful if you just want to try out this tool initially]
- Upload data file [this allows you to upload data directly by clicking on choose file and selecting the appropriate file. This option only works for .txt, .tsv or .xlsx files - see (i) above]
Click on View Data. Your data is displayed (if you have gone for option (i) above, you will able to select split sentences or whole text for your data display).
The Start Analysis bar at the bottom of the screen will flash and clicking on it will open up seven colour-coded options. Click on the blue one Sentiment Chart.

A scatter plot (similar to the one above) based on the data you have inputted will then be produced.
A search the chart box allows you to look for a particular word which might be of interest to your analysis on the chart. Download interactive scatter text at the bottom of the page enables you to download a discrete copy of your own scatter plot.
The summarisation tab is self-explanatory. It allows you to create a basic summary of the text you are using. It is based on the ACC (Welsh Automatic Text Summarisation) project and you can find more information about that in the Analyse section of the Welsh Digital Grid site > http://digigrid.cymru/analyse/.
The summariser can be useful in giving you an initial overview of your data - the main thrust of what it is telling you - and may help you to formulate the next stage of your analysis.
From the FreeTxt Home page, click on Analysis.
- Paste a text [copy and paste text into the box this is useful if your data is not a .txt, .tsv or .xlsx file e.g. data you may have in a WORD document]
- Use example data [you will need to select from the options below - this is useful if you just want to try out this tool initially]
- Upload data file [this allows you to upload data directly by clicking on choose file and selecting the appropriate file. This option only works for .txt, .tsv or .xlsx files - see (i) above]
Click on View Data. Your data is displayed (if you have gone for option (i) above, you will able to select split sentences or whole text for your data display).
The Start Analysis bar at the bottom of the screen will flash and clicking on it will open up seven colour-coded options. Click on the yellow one Summarisation.

This will produce a summary which equates to 40% of the text which you have uploaded. In the example below - based on the example data in FreeTxt - you can see 40% noted in the top left hand side of the screenshot. This can be adjusted to suit the needs of your particular analysis by clicking along the line above the summary.

Clicking on Download Summary allows you to save a copy of your summary to your own device.
When we have a large amount of text, it can be useful sometimes to visualize everything in such a way that all the key words - that is the words which are used most often in the text - are clearly larger and more prominent than others which occur less often.
A Word Cloud is one way which enables us to do this. We call it a word cloud because this information is often (but not always) shown in the shape of a cloud. Below is an example of a word cloud (not in the shape of a cloud!) created using text relating to the TV show Dr Who:

Clearly, the most commonly used word here is Doctor as we might expect (its larger size, compared to the other words, tells us this). Other commonly used words include: BBC, series, time, episode/s, television, and first.
A word cloud is a handy tool for giving us a visual representation of what the important and stand-out words in a piece of text are. This can be useful, for example, in presenting the main emphasis within a text in a simple, visual way to an audience who might be interested in the topic. An example of this is how some news outlets' online sites (e.g., Sky News) occasionally use a word cloud to illustrate what the most frequent words in an important political speech were i.e., where the main emphasis was concentrated and what that tells us about the message being conveyed. Using a word cloud to do this may be a more effective way of illustrating this to the reader than just through a news article.
The size of the words in some word clouds is directly related to how often they occur in the text you are looking at - these are word clouds based on the frequency of words in your text. Word clouds can also tell us about the nature of the key words in them - for example, as the word the is the most common word in the English language, this is the word that we expect to be used most often in a text. Showing the in a word cloud wouldn’t be particularly interesting as it doesn’t show us anything we wouldn’t expect. The is not ‘key’ to a particular text, as it is common to all texts. If a word like castle occurs a lot of time in your text (perhaps if you are looking at reviews of a castle!), it would be defined as ‘key’ because it isn’t expected to be common in everyday language. Key words tell us what the most significant words in a given text are (by comparing their frequency to a 100 million word dataset of written and spoken language called the British National Corpus). Key words are calculated using a measure called the keyness value and we would call a word cloud which is directly related to keyness value rather than solely frequency a key word cloud. You can choose which option you would prefer for your own analysis within the word cloud tool (see below) – the key word cloud option is the default option for FreeTxt.
From the FreeTxt Home page, click on Analysis. You can either:
- Paste a text: [copy and paste text into the box - this is useful if your data is not a .txt, .tsv, or .xlsx file e.g., data you may have in a WORD document]
- Use example data: [you will need to select from the options below - this is useful if you just want to try out this tool initially]
- Upload data file: [this allows you to upload data directly by clicking on choose file and selecting the appropriate file. This option only works for .txt, .tsv, or .xlsx files - see (i) above]
Click on View Data.
Your data is displayed (if you have gone for option (i) above, you will able to select split sentences or whole text for your data display).
The Start Analysis bar at the bottom of the screen will flash and clicking on it will open up seven colour-coded options. Click on the purple one Word Cloud.

The next screenshot illustrates the options you will be offered to create your own bespoke word cloud based on the text / data you wish to analyse:

The four options are:
-
Select cloud type
: The default here is for
All words
However, this can be changed to restrict the word cloud to
certain parts of speech e.g. nouns, verbs. In addition, semantic
tags can be selected to visualise the semantic areas (i.e. the
broad groups of meaning that words can be classified in to – for
example, the words football, hockey and tennis would be
classfied as being related to sport – for more details of the
categories included in semantic tags, see here:
https://ucrel.lancs.ac.uk/usas/). There is also the possibility
to select 2 / 3 / 4 - word clusters. These allow you to view the
most common strings of words that occur in a text, for example I
loved it would be a 3 word cluster and Chepstow Castle would be
a 2 word cluster. Below is a screenshot of a dragon shaped
word cloud using FreeTxt's example data and
2-word clusters:
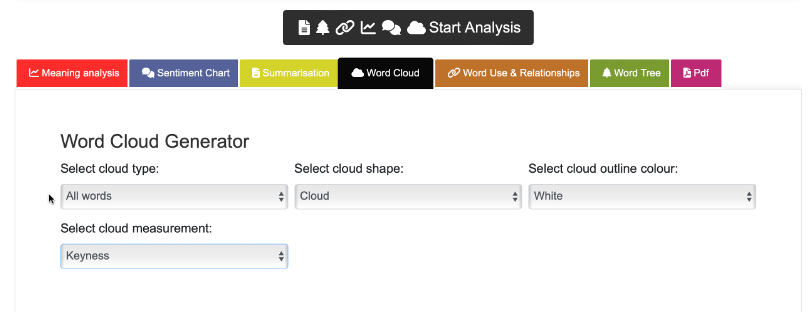
- Select cloud shape: The default option here is cloud. However, as the above screenshot illustrates, the word cloud can be changed to any of the following shapes: Comment / Light bulb / Volume up / Microphone / Welsh flag / Sherlock Holmes / National Trust / Cadw / Rectangle / Circle / Cadw2
- Select cloud outline colour: The default is white but further options include grey, yellow, black, green, blue, or red.
- Select cloud measurement: This refers back to the section above about keyness and frequency. The default option is keyness.
The screenshot below is once again based on the example data in FreeTxt using (1) All words (2) Sherlock Holmes (3) Blue and (4) Frequency:

Here you are able to analyse how the words in your data are used (in particular in connection with each other) and what their relationships can tell you about the wider meaning of your text. It is useful to consider more closely how different words can have a different meaning or tell a different story when they occur together. Their relationship with each other and the coming together of two words in this way can be referred to as collocations.
It might be helpful to think of this term collocation as two parts - the second one location tells us where something is and the first part co- is often used to make us think of something together (e.g. cooperate - working together). So, collocation will tell us about words which are often located together and because they are located together, they combine to give a particular meaning.
Let's look at a word like pay for example. On its own, it can be a verb to pay someone or a noun I received my pay today. However, it is possible to locate other words together with pay to create combinations with specific meanings. Some examples might be:
- Equal pay
- Pay packet
- Pay scale
- Half pay
- Gladly pay
- Pay up
These combinations all add to the meaning of the verb or noun pay and occur naturally in language. In the first four examples, pay = money or earnings but the combinations we have noted with equal / packet / scale / half would not work with money as well.
Equal money is a possible collocation of money but money packet, money scale and half money are not.
Being able to search for collocations in your text will help you get a greater understanding of meanings which only become apparent when we see two words located together. If we consider, for example, text which includes feedback on accommodation. It is probable that the word room will be a high frequency word, that is one which occurs very often in the text.
However, in order for the accommodation owner to understand and analyse that information in more detail, being able to identify collocations with room would be a very useful tool:
- Which adjectives collocate with room and what do they tell us about it e.g. warm or hot / cold; noisy or quiet; double or single.
- Does the text refer to specific rooms e.g. dining / bed / reception?
- Are there any other specific collocations which help the accommodation owner understand more about what is targeted in the feedback e.g. room key / room rates / adjoining room?
From the FreeTxt Home page, click on Analysis.
You can either:
- (i) Paste a text [copy and paste text into the box - this is useful if your data is not a .txt, .tsv or .xlsx file e.g. data you may have in a WORD document]
- (ii) Use example data [you will need to select from the options below - this is useful if you just want to try out this tool initially]
- (iii) Upload data file [this allows you to upload data directly by clicking on choose file and selecting the appropriate file. This option only works for .txt, .tsv or .xlsx files - see (i) above]
Click on View Data.
Your data is displayed (if you have gone for option (i) above, you will able to select split sentences or whole text for your data display).
The Start Analysis bar at the bottom of the screen will flash and clicking on it will open up seven colour-coded options. Click on the brown one Word Use & Relationships.

You will be asked to select a word for analysis (see screenshot below). You will need to tell FreeTxt whether you wish to use the word category (the default setting) or choose the POS tag (Part Of Speech) or the Semantic tag. The word for analysis in our example is hotel and this is based on the example data in FreeTxt. In addition, when considering the visualization of your data, you are able to adjust the window size by clicking along the line below it.

The select a word for analysis options you have selected will illustrate your keyword as in the next screenshot. 10 entries are shown here but this can be adjusted by clicking on the Show entries box. In window size, 5 is selected so the five words to the left of the keyword are shown under Left Context as are the five to the right in Right Context. Clicking on either of these headings will arrange the data in accordance with the appropriate context selected.

You can also search for specific words that are used in the right and left context of your search term (this visualization is called a concordance output). To do this, simply type your word into the search box seen at the top right of the image above.
Download keyword results allows you to save the results from your analysis away from the FreeTxt site.
Referring to the discussions on collocations (above), a list of collocations for hotel in the data is presented below the concordance output. Again, this can be downloaded as a discrete file by clicking on Download Collocation Results. The example used here has limited data and so the frequency is not so great (i.e. the amount of times each word in your text occurs) - however, the greater the amount of data used, the higher the frequency number will be. The other columns relate to MI - Mutual Information and LL - Log Likelihood (the MI score is a statistical measure that shows the strength of association between words; LL is a probability statistic that compares the frequency of co-occurrence of two words). Clicking on any of the column headings will arrange the data in order of the specific column selected. Once again, this analysis can be downloaded for use outside of FreeTxt. If you selected a particular POS Tag or Semantic Tag at the start of your analysis, the words shown in this table are those which most frequently occur within that given category.

Finally, you are also able to visualise this data as an interactive network graph (see below). Not only does this allow you to see the connections - the relationships - between the word you have chosen, but it also allows you to move the click on items and move them around, to make them easier to see and/or to allow you to present the words in whatever way you prefer. The graph can be dowloaded by clicking on the download interactive network graph tab underneath.
It is useful to read the user guide for Word Use and Relationships in combination with this guide as it gives information on combinations of words often referred to as collocations.
The Word Tree tab will require you to input a search word. In the case below, hotel (based on the FreeTxt example data) is the search word. You will be presented with information which explains what a word tree is and how to interpret the information contained within it.

From the FreeTxt Home page, click on Analysis. You can either:
- Paste a text [copy and paste text into the box - this is useful if your data is not a .txt, .tsv or .xlsx file e.g., data you may have in a WORD document]
- Use example data [you will need to select from the options below - this is useful if you just want to try out this tool initially]
- Upload data file [this allows you to upload data directly by clicking on choose file and selecting the appropriate file. This option only works for .txt, .tsv or .xlsx files - see (i) above]
Click on View Data.
Your data is displayed (if you have gone for option (i) above, you will able to select split sentences or whole text for your data display).
The Start Analysis bar at the bottom of the screen will flash and clicking on it will open up seven colour-coded options. Click on the green one Word Tree.

As mentioned above, you will be asked to select a word for analysis and Word Tree will create a visualisation (= the word tree) based on your selection. The screenshot below shows the word tree based on the search word hotel in the FreeTxt example data. (See above for guidance on how to interpret the word tree).

The word tree is fully interactive, so you are able to click any word in the tree to see what words commonly occur before and after it. If you click on the word Great in the above image, you will see the new word tree below. This interactive functionality means you can really delve deep into your data to see what patterns exist.

If you scroll over any word in the word tree you will see information about the weight of the word. This is the frequency of the word. The word tree below shows that the word price is used once in the example text.

Clicking on Download Interactive Word Tree allows you to save a copy of the word tree you have created for further use in your own analysis.